
Status after the first year (WP2)
Results September 2012 - 2013
The remote sensing, geophysical surveying and the production of a geological model are well under way for the test sites at Tudse Hage, Denmark, and Cape Sounion, Greece (Figure 1)
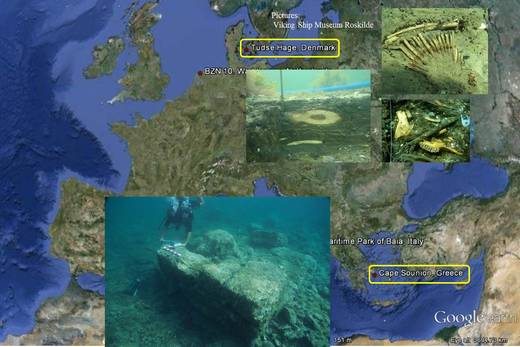
- Figure 1: WP1 and WP2 study areas at Tudse Hage and Cape Sounion. Photo: UPAT and The Viking Ship Museum

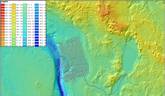
Considerable progress has been achieved during the first year of the project. In WP1 the World View 2 high resolution satellite images for the test site areas were obtained, (Figure 2a,c).
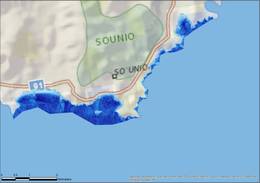
Below you find 2 World View satellite images at (A) Tudse Hage /DK; and (C) Cape Sounion /GR.
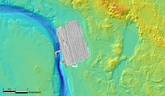
Also shown bathymetry data extracted from the satellite images at (B) Tudse Hage, and (D) Sounion.
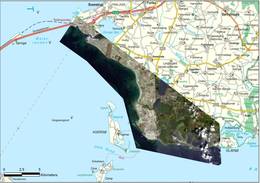
- Figure 2A. Photo: GEUS
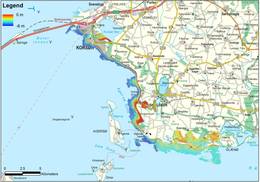
- Figure 2B. Photo: GEUS
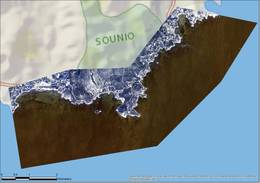
- Figure 2C. Photo: GEUS
- Figure 2D. Photo: GEUS
These figures reveal the 8 band satellite images as well as the calculated bathymetry deduced from the satellite images calibrated with measured points provided by the relevant partners. The bathymetry was truncated to 5-6 metres depth at Tudse Hage and 12 metres at Cape Sounion due to water clarity and seabed slope. The satellite images, the bathymetry, the sediment map, available information and expert judgment were used to optimise the planning of the areas where the geophysical survey was later conducted.
The field work was conducted in the summer of 2013 and the data was analysed and potential locations for coring were delineated (Figure 3). Coring off-shore was conducted at Tudse Hage Denmark. The core samples will be used for dating and construction of the geological model and the paleogeographical environment of the area. To get a complete sequence of sea level rise in the area which will positively determine probable locations of potential archaeological sites in the Tudse Hage study area, an on-shore GeoRadar survey was suggested at the on-shore region east of the area where off-shore coring took place; this will be conducted in October 2013 and sediment cores will also be taken from the area for dating.
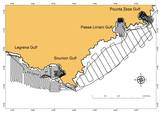
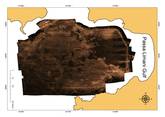
In the Greek study area (Cape Sounion) field work included the gulfs of Passalimani, Pountazeza, Sounio and Legrena and was conducted using multibeam, side scan sonar (two systems), sub-bottom profilers (two systems) and magnetometer. The data collected will be compared with each other and with the data from the satellite images. Furthermore the results of the geophysical survey will be combined with the submerged archaeological findings in order to depict the geological model and the palaeogeographic evolution of the coastal zone of the area.
- A. Photo: GEUS

- B. Photo: GEUS

- C. Photo: GEUS

- D. Photo: GEUS

- E. Photo: GEUS

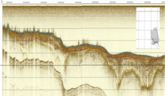
- F. Photo: GEUS

- G. Photo: UPAT
- H. Photo: UPAT
- I. Photo: UPAT
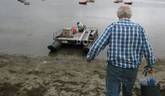
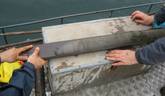
Figure 3: WP2 field work activity in 2013. A: Multibeam echosounder on board Maritina, DK. B: Coring at Tudse Hage with a coring raft and a Russian Corer, DK. C: Extracted sediment cores, DK. D: Processed multibeam bathymetry data merged with satellite bathymetry and land DTM, DK. E: Sidescan image of the survey area, DK. F: Seismic profile taken with Innomar parametric sub-bottom profiler, DK. G: Survey boat with sidescan fish in Sounion, GR. H: Survey lines for the geophysical survey, GR. I: Sidescan image of a surveyed area in Sounion, GR.
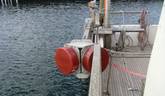
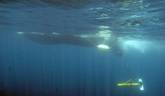
An innovative sub-bottom 3D imaging system is being developed and will be used in the allocated test sites for detailed studies in the Summer of 2014. A parametric transducer array has been designed and manufactured by Innomar Technologie GmbH,. The transducer was field tested in a local Marina and data have been collected for further analysis. Preliminary results indicate that the array is working within its design specifications.
The next step in these work packages will be the production of a GIS based database encompassing all the background data used in the production of a geological and palaeogeographic model. The model and the archaeological information of prehistoric sites will be incorporated into a GIS platform where the potential archaeological sites in the test site areas and their environmental status and stability are elucidated. The 3D sub-bottom profiler will be used in the surveyed test areas to produce a fully geo-referenced 3D image of the archaeological sites.
Zyad Al-Hamdani, Maria Geraga, George Pantopoulos, George Papatheodorou and Jens Wunderlich